The Solar Surge That Redefined Energy Benchmarks
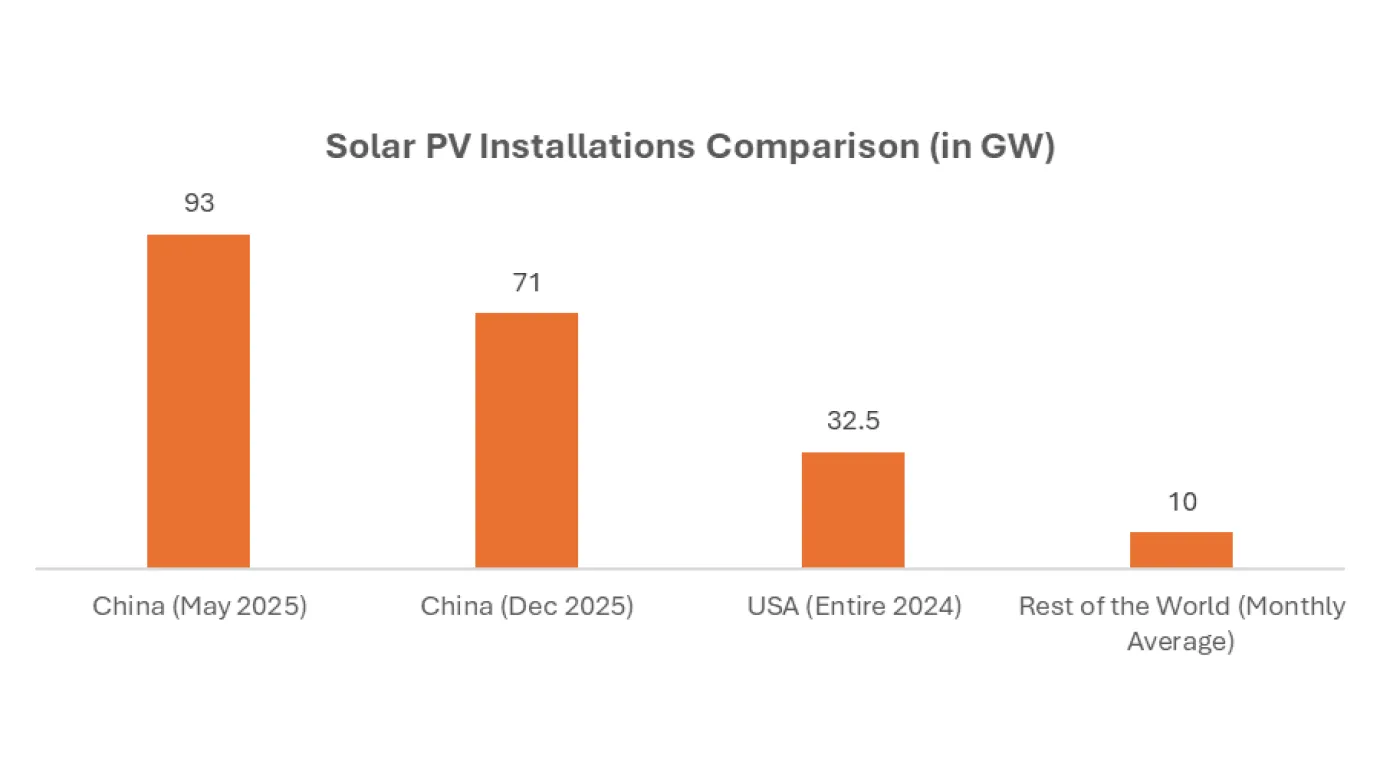
In May 2025, China installed an unprecedented 92.92 GW of solar photovoltaic (PV) capacity in just one month. To contextualize the magnitude, this figure is nearly 4X greater than May 2024’s deployment and almost triples the annual solar capacity addition projected for the entire United States in 2025 (32.5 GW). This utility-scale solar buildout not only shattered global records but also marked a structural shift in how nations might approach energy transition roadmaps in the decade ahead.
Between January and April 2025, China had already added 104.9 GW of solar installations, including 45.2 GW in April alone, a 215 percent year-on-year increase. The country’s cumulative solar capacity as of May end reached 1.08 terawatts (TW), up 56.9 percent year-on-year. Renewables now contribute approximately 60 percent of total national generation capacity, with solar and wind leading this transformation across China’s solar energy market.
However, the China Photovoltaic Industry Association (CPIA) has forecasted a downward trend for the remainder of the year. 2025 installations are expected to range between 215 and 255 GW, a potential 8 to 23 percent decline from the 277 GW installed in 2024. This anticipated slowdown follows a critical policy shift from June 2025, all newly generated renewable power must be sold at market-determined prices, eliminating legacy feed-in tariffs and accelerating price parity.
The Infrastructure Gap Behind the Growth Story
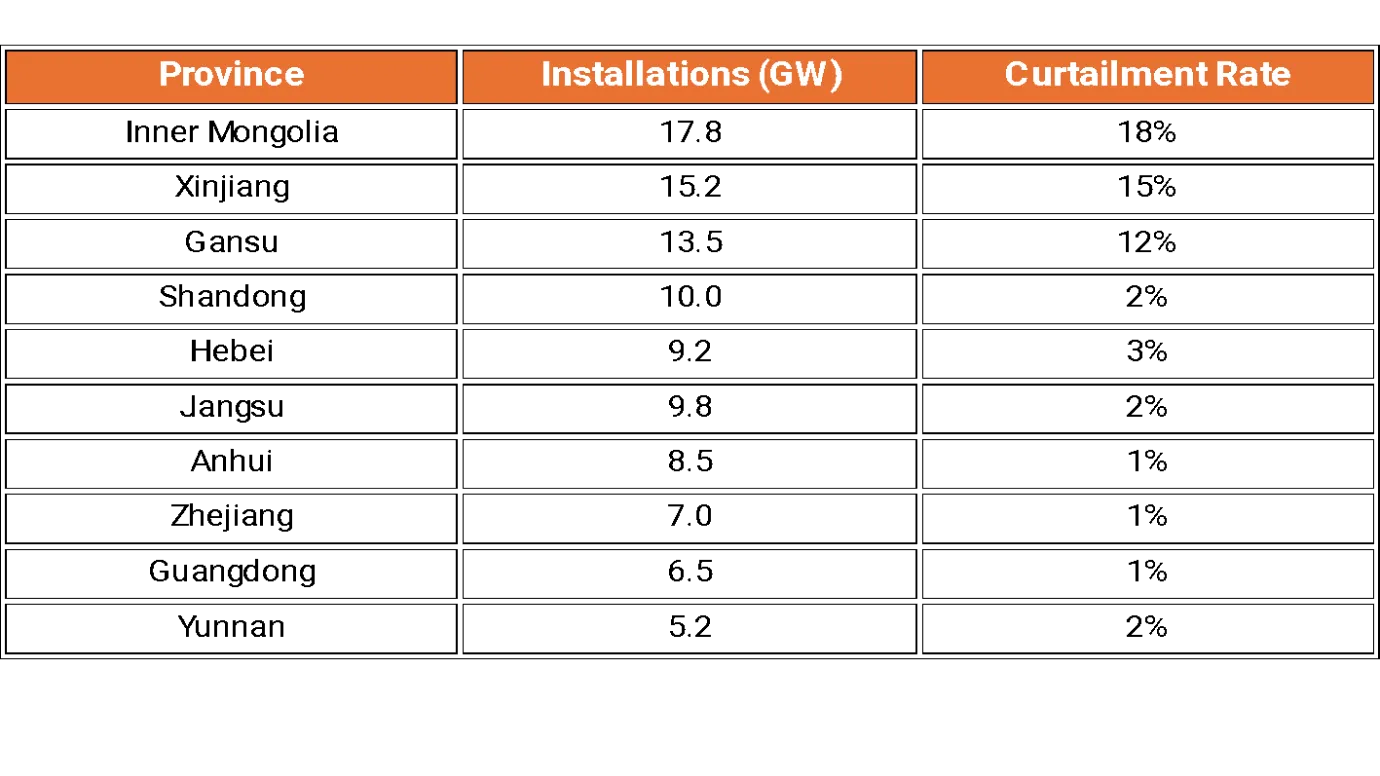
Despite the impressive growth, China’s solar deployment story is more nuanced when examined through the lens of operational efficiency and curtailment risk. Grid infrastructure in western provinces such as Inner Mongolia (17.8 GW), Xinjiang (15.2 GW), and Gansu (13.5 GW) is failing to keep pace with the scale of installed capacity. These regions now report curtailment rates of 12 to 18 percent, significantly undermining energy yield and investor returns in high-capacity zones.
In contrast, eastern and southern coastal provinces, including Jiangsu, Zhejiang, and Guangdong, although installing comparatively smaller capacities ranging from 6.5 to 9.8 GW, maintain curtailment rates as low as 1 to 2 percent. Their proximity to industrial load centers, superior transmission infrastructure, and higher grid absorption rates make these regions more favorable for distributed solar investments and rooftop PV deployments.
This spatial disparity underlines a critical challenge: the energy transition must be grid-synchronized, not just capacity-led. Failure to align generation with load centers and grid readiness will increase stranded assets, reduce capacity utilization factors (CUF), and create operational bottlenecks. For utility-scale solar developers, this represents both a constraint and a catalyst for adopting intelligent energy forecasting systems.
Economics and Policy at the Forefront
The sudden May surge was largely driven by time-sensitive policy dynamics. Developers raced to commission projects before the June 1st market liberalization deadline. This urgency was especially pronounced in the distributed generation (DG) segment, particularly commercial and industrial (C&I) rooftops, which contributed approximately 60 GW across April and May alone.
Simultaneously, the industry is battling overcapacity and price deflation. Wafer and module prices in China dropped sharply, with TOPCon modules falling to RMB 0.65 to 0.66 per watt, equivalent to approximately USD 0.089 to 0.090 per watt (based on prevailing exchange rates of ~7.25 RMB/USD) in late May, among the lowest global prices recorded to date. Internationally, average site-level pricing declined 5 to 6 percent, a direct result of aggressive supply-side dynamics in the global solar energy market.
Meanwhile, renewables continue to dominate China’s energy landscape. In Q1 2025, solar alone contributed 42.5 GW out of 76.5 GW of newly installed capacity, while thermal power sources grew by just 4 percent. Solar and wind generation now contribute nearly 39 percent of total electricity output, making zero-carbon power the core of China’s grid strategy and utility-scale generation mix.
Yet these capacity milestones contrast with persistent curtailment risks. National solar curtailment stands at 7 percent, but in provinces like Gansu and Inner Mongolia, localized rates have touched 20 percent. These figures reflect a widening gap between installed capacity and effective generation, highlighting the need for advanced curtailment modelling tools.
Bridging Scale with Intelligence
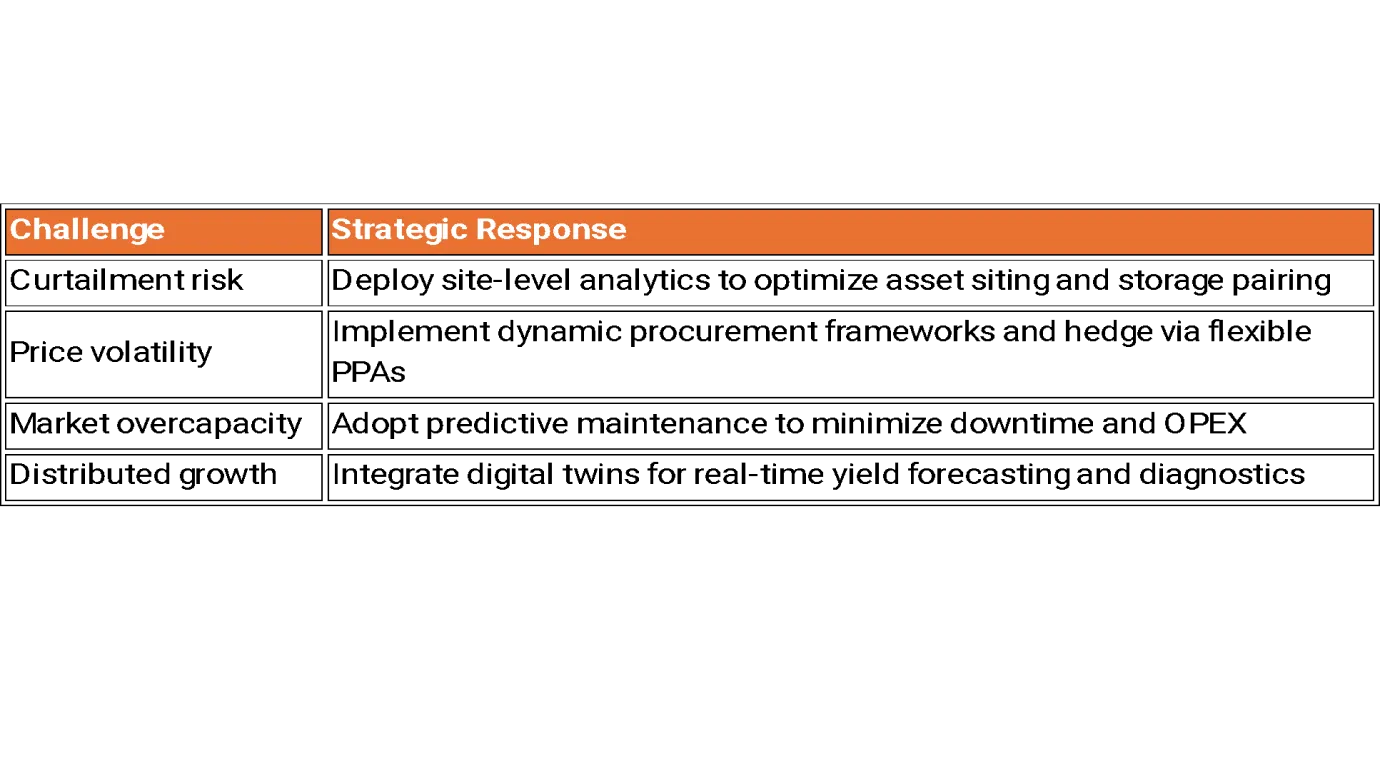
To unlock value from scale, operators and investors must transition from capacity-centric to intelligence-driven strategies. Below is a mapping of major challenges and their actionable countermeasures:
This is where platforms like Apollo Energy Analytics provide tangible differentiation. Apollo enables:
- Module-level performance diagnostics to detect anomalies early
- AI-powered yield forecasting using meteorological, irradiance, and inverter data
- Curtailment risk modelling to assess storage ROI and dispatchability
By merging real-time SCADA data with AI-driven inference models, Apollo empowers solar asset owners to move from reactive firefighting to proactive lifecycle optimization. This is essential in today’s decentralized energy ecosystem, where digital twins and asset performance management (APM) systems are becoming standard practice.
Final Thoughts: From Megawatts to Smart Watts
China’s 93 GW sprint in May is not a mere statistical anomaly, it represents a turning point in the global energy game. But scale, on its own, is not a proxy for success. The road ahead demands:
- Utilization parity between west-heavy generation zones and east-heavy demand corridors
- Operational agility amidst price wars, overcapacity, and evolving policy frameworks
- Digitization depth to manage increasingly decentralized, heterogeneous asset fleets
- Global strategy alignment as China’s upstream dominance impacts international market dynamics
The next decade of solar growth will not be defined by how much capacity we build, but by how intelligently we manage and monetize it. For stakeholders navigating this complexity, real-time intelligence platforms like Apollo are not just helpful, they are foundational.
Ready to Lead the Smart Solar Revolution?
Apollo offers:
- Predictive yield forecasting to reduce downtime by up to 30 percent
- AI-powered analysis with patented digital twin technology
- Curtailment risk maps with integrated storage modeling
Write to us at contact@apolloenergyinsights.com and let us future-proof your solar portfolio with data, not just ambition. If you’re looking to optimize your solar O&M, integrate predictive analytics, or navigate renewable energy policy changes, Apollo has the tools to lead the way.


Leave a Reply